|
Vector Analysis of Astigmatism |
  
|
|
Vector Analysis of Astigmatism |
|
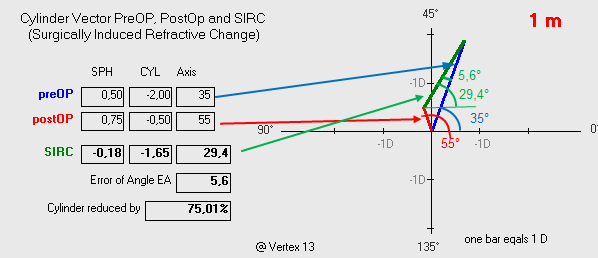
Datagraph-med uses vector analysis to calculate the surgically induced refractive change (SIRC), taking into account any cylinder axis change. This calculation is done for each follow up exam individually and can be seen on the astigmatism tab of the data entry form.
The double angel vector pictograph corresponds to the selected follow up time interval. (click FU line in the table above!)
The blue line indicates the preOP cylinder and axis value in the standard minus cylinder form (sph -cyl X axis)
The red line indicated the postOP cylinder and axis.
The surgically induced change in cylinder is represented by the green line.
The corresponding axis values can be seen in the graph below. Note this is a double angle plot, doubling 180° to a full circle.
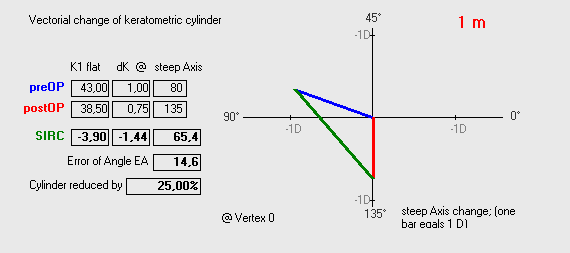
For Keratometric astigmatism changes the following graph is used. Note that SIRC axis values are given in power notation (sph -cyl @ axis).
For more details on vector calculation please see the original article 'Calculating the surgically induced refractive change following ocular surgery'
from Jack T. Holladay, Thomas V. Cravy, Douglas D. Koch; Journal of Cataract & Refractive Surgery, Vol. 18, Issue 5, p429–443, September 1992