Navigation: Making Graphs > Additional Graphs >
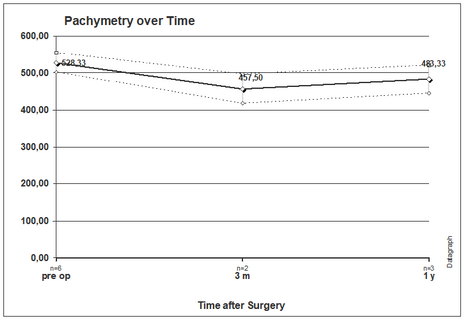
Pachymetry over Time
This graph shows the average corneal thicknes at different time intervals. The dashed lines indicate one standard deviation.