|
Spherical Aberration |
  
|
|
Spherical Aberration |
|
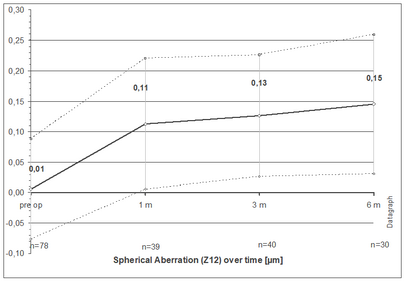
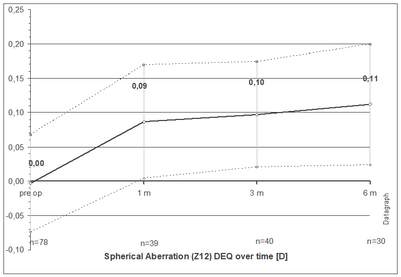
The zernike term number 12 represents the amount of positive or negative spherical aberration. This graph plots the average values over time including ±1 standard deviation.
The values can be given either in µm (above) or in diopters (below).